Your spreadsheet.
Your starting point.
Paste from Sheets or Excel, or import CSV and TSV. Turn up to 24 rows and three series into a clear visual story, ready to insert into Framer.
YOUR NEXT PROJECT STARTS HERE
Turn spreadsheet data into SVG charts for your Framer canvas. One purchase unlocks the plugin for your own and client projects.
Turn that spreadsheet into the chart your next case study deserves. Beautiful SVG charts, made for your Framer canvas.
| Month | This year | Last year |
|---|---|---|
| Jan | 28 | 18 |
| Feb | 35 | 22 |
| Mar | 32 | 27 |
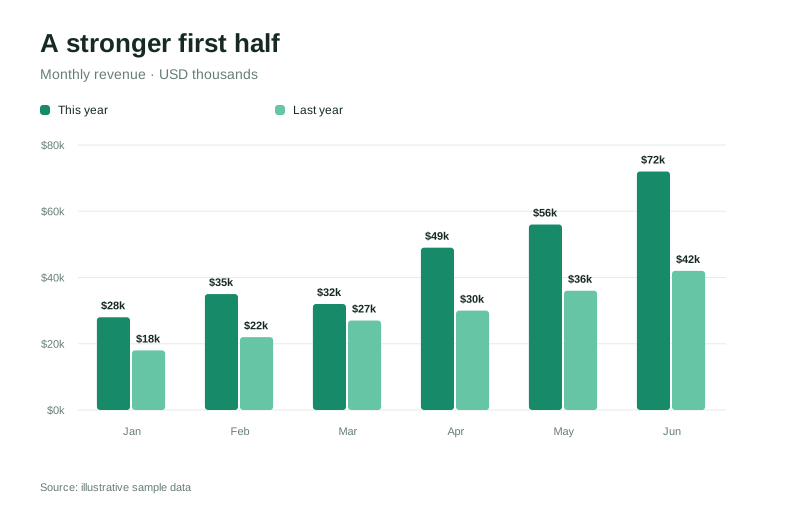
Pick a chart. Find your palette. Go dark. Explore real ChartMint sample output and see how good your next data story could look.
| Month | This year | Last year |
|---|---|---|
| Jan | 28 | 18 |
| Feb | 35 | 22 |
| Mar | 32 | 27 |
| Apr | 49 | 30 |
| May | 56 | 36 |
| Jun | 72 | 42 |
Paste from Sheets or Excel, or import CSV and TSV. Turn up to 24 rows and three series into a clear visual story, ready to insert into Framer.
Four palettes, your own brand accent, light and dark finishes, headlines and source notes. Add currency or percentage formatting for a considered final result.
Save a reusable recipe, update your data and create a fresh SVG whenever you need it. ChartMint processes data locally and uses Framer’s documented SDK to insert a new image frame.
Give your work the chart it deserves. Buy through Stripe, get your key by email and activate ChartMint inside Framer.
ChartMint on Framer Marketplace ↗